- Posted on: 2024-06-05
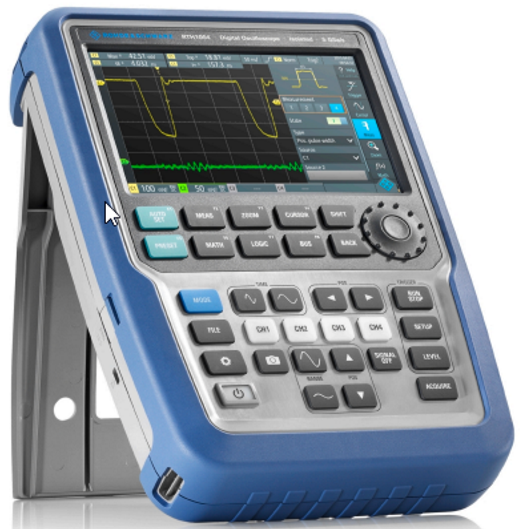
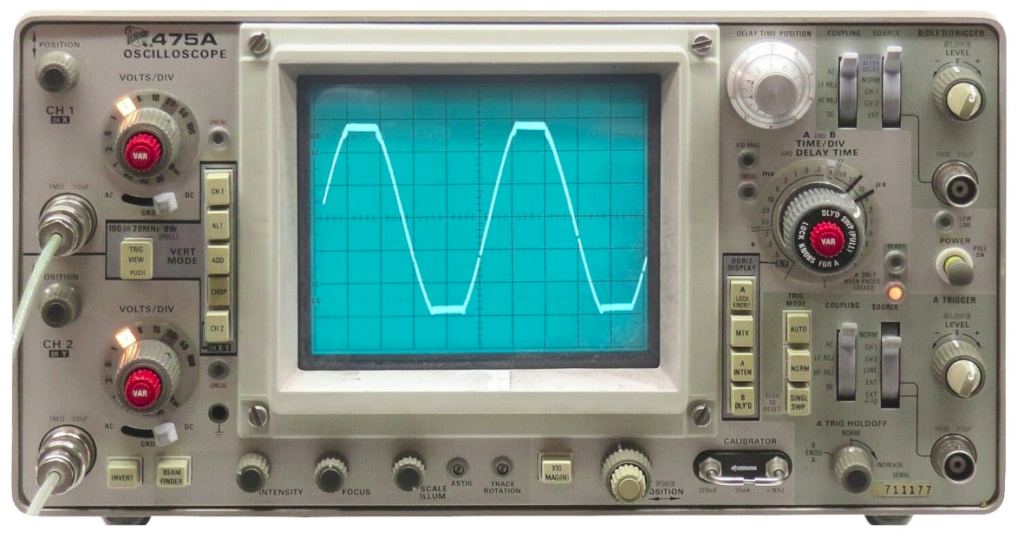
Oscilloscopes have been around for a very long time. First analog and then digital since the 1990s, they allow the human to see electrical signals that change in microseconds and even faster
With 2, 4, 8 and even 20 channels (digital), they can provide a lot of information about complex sequences of events that cannot easily be viewed otherwise. Unlike traditional data acquisition (DAQ) devices performing measurements continuously, oscilloscopes record a short sequence of readings at a given time. Conditions must therefore be given to the instruments to decide when it must record and display its readings.
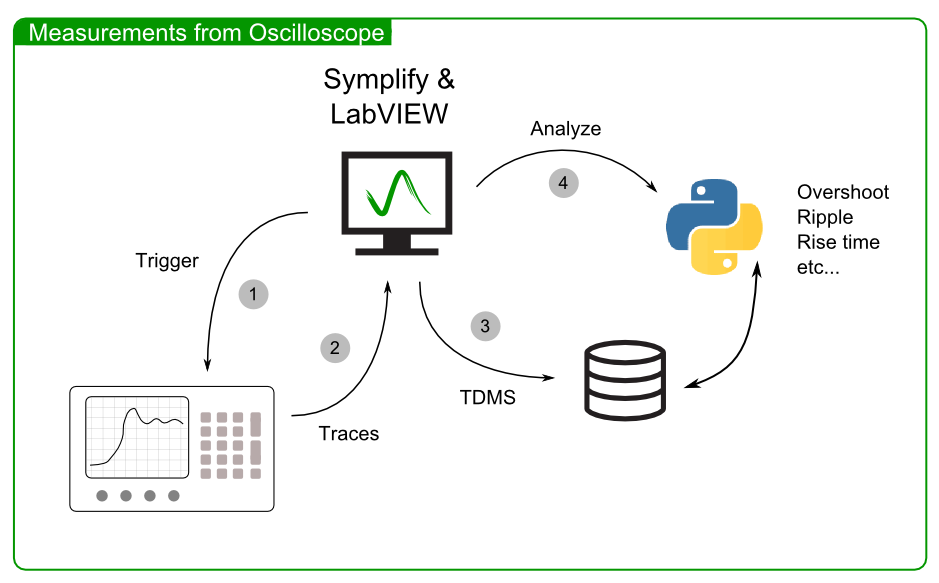
Most recent oscilloscopes can be connected to a computer and controlled remotely. It should therefore be pretty common to see those instruments integrated in automated test systems (ATS) to accelerate the validation of designs. It is easy to see that the computer is much faster than the human eye to analyze hundreds or even thousands of traces.
However, the sequence of commands to Configure -> Arm -> Record -> Analyze (for each channel) is fragmented and can be difficult to integrate in a test application with a rigid architecture. There can easily be 25 parameters to configure and more than 30 commands to exchange between the computer and oscilloscope to complete a single acquisition. That sequence is prone to generating software exceptions (Error Cluster in LabVIEW) and difficult to properly configure for each test case.

How Symplify Now!™ solves the problem of integrating oscilloscopes
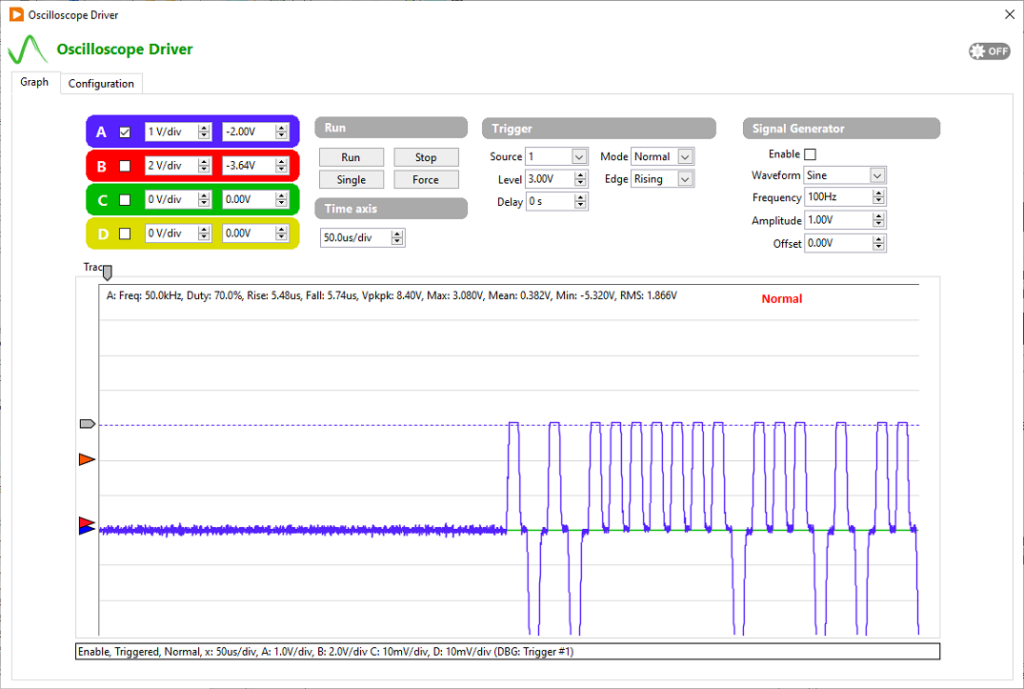
To solve the traditional problems of controlling an oscilloscope from a computer in an automated test system, Symplify exposes many Tags to the user such that each of the scope channel parameters can be modified independently. Similar Tags let users configure the trigger’s parameters and the time base (horizontal axis, µs/division).
After the oscilloscope is armed and the trigger condition is met, Symplify automatically requests the traces from the instruments. As one could imagine, this data is displayed on a standard graph in the driver’s window. However, the true value of collecting the trace from the computer becomes clearer on the image below. The traces are always stored on disk (in a circular buffer to manage the disk space used) in TDMS files with the date/time information in the file name along with any extra identifier such as the DUT’s serial number, firmware version, etc. They can therefore be analyzed in custom Python scripts in real-time and later be reviewed again quickly in Symplify`s TDMS viewer.
The file path of the recently recorded TDMS files with the captured data from the oscilloscope are stored as Tags so Python script (or any other test executive or LabVIEW custom code) can easily find the latest data to analyze.
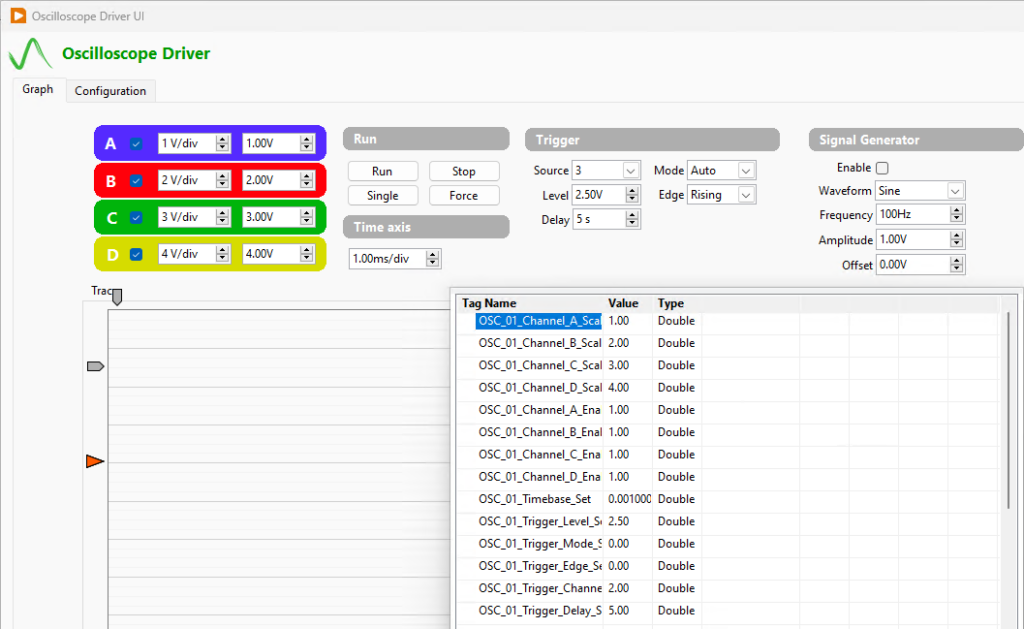
On the image below, many of the Tags used by the oscilloscope driver are displayed along side their visual representation on the driver’s user interface. Each Tag is named with a “_01_” name in the example below because a system can be made of 2 or more oscilloscopes, each controlled by the same application.
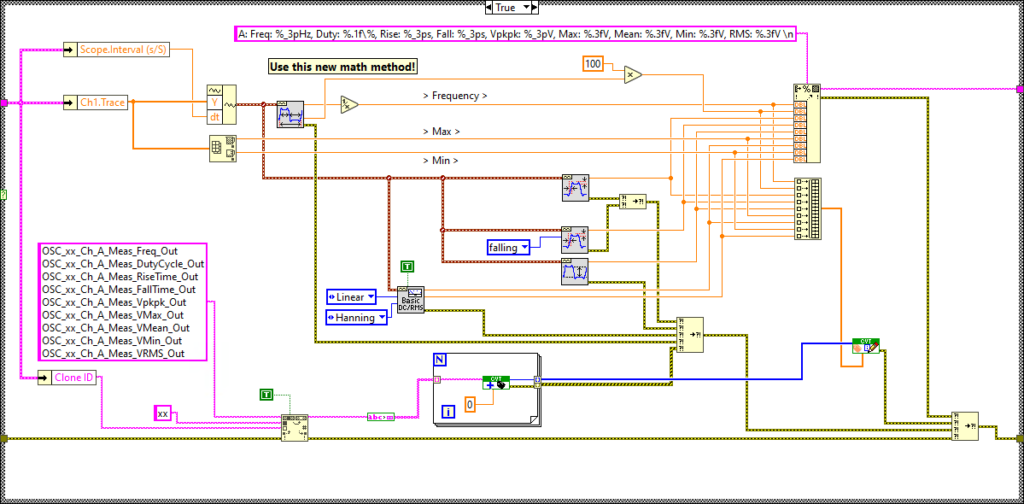
Finally, the driver performs some basic measurements on each trace. They image below depicts the LabVIEW code performing this computation on each channel and the names of the Tags used to store the results.
Watch it in action
There are many videos available in the video section that describe our drivers, including the standard SCPI driver found in Symplify Now! The video library can be found here: https://www.synovus.ca/symplify-video-gallery/.
There is also a specific page dedicated to the standard SCPI driver. IT can be found here: https://www.synovus.ca/generic-scpi-driver/.
Don’t hesitate to contact us if you want to know how Synovus and Symplify can help you reduce development and troubleshooting time to bring better products to market faster.
